Research Projects
Please find here summary descriptions of the various research project ongoing in the geodynamics group at the University of Maryland. Don't hesitate to contact Dr. Montési if you have any comment or question, or if you are interested in participating in these activities.
Please note that the references in these resumés are limited to our own publications. There is clearly a lot of scientific activity by other groups in any of these topics that we recognize and cite in our actual publications. However, this webpage is not a scientific publication but a summary of our activities, hence the bias you may see here.
- Melt Extraction at Mid-Ocean Ridges
- Melt distribution and permeability
- Mantle flow at subduction zones
- Shear zones and plate tectonics
- Tectonics of Mercury
- Tectonics of Europa
- Volcanism on Mars
- Earthquakes
- Marine Geology
Mid-Ocean Ridges are the location where ocean plates move apart from one another. Warm mantle rises to fill the gap between these plates and starts melting. The melt is extracted to the surface, forming new crust. We study the processes by which this melt is extracted to better understand the trajectory of melt beneath the crust and its geochemical evolution.
Participants
- Hailong Bai
- Mark Larson
- Laura Hebert
- Trish Gregg
- Mark Behn
- Laurent Montesi
We developed a simplified 3-step scenario of melt extraction.
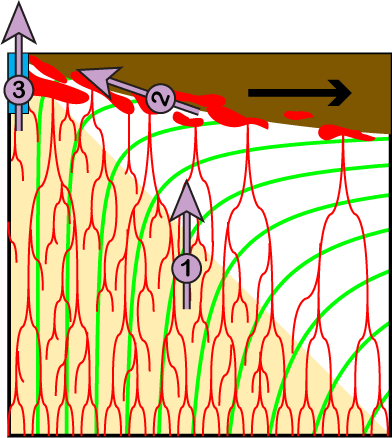
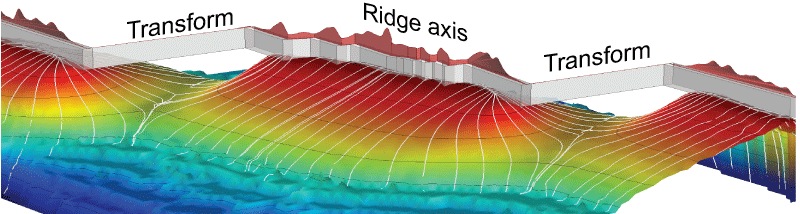
Schematic diagram of our three-step melt extraction model (purple arrows). Cross-sectional view underneath a ridge (top left) with the thickening lithosphere (brown) moving to the right dragging the mantle along the green trajectories. Melting takes place in the tan triangle. The red bodies represent the conceptual distribution of melt.
- Step 1: In the warm sublithospheric mantle where melt is in present at thermodynamic equilibrium, melt rises vertically at high speed reaching m/yr under the influence of its intrisinc buoyancy and the development of sub-vertical high-porosity channels.
- Step 2: As melt enters the cooler lithosphere, it crystallized and forms a permeability barrier at a critical temperature. Melt accumulates in a decompaction channel at the base of this barrier. Melt travels upwards along the barrier following its highest slope, typically going towards the ridge axis, where the lithosphere is thinnest. The permeability barrier appears at temperature 1240°C+1.9 z, where z is the depth in km. The thermodynamic bases for this barrier where described by Hebert and Montési, (2010).
- Step 3: Melt reaches the surface where it encounters a region where the lithosphere is damaged (Melt Extraction Zone, or MEZ). This region is associated with the plate boundary, whether a spreading center or a tranform fault. We estimate that the MEZ extends 2 to 4 km off the axis to a depth of 15 to 20 km, possibly more at ultraslow spreading centers.
See Gregg et al., (2012), for a review of our model and its implications for mid-ocean ridges
We implemented this simple model to simulate melt trajectories in three dimensions based on thermo-mechanical models of mantle flow under specific regions of the globe. We implement in there models a simplified geometry that capture the essential elements of the ridge geometry in the study area and compare the patterns of crustal accreation and crustal thickness predicted in these models with geophysical observations.
This model has now been applied to several location along the global mid-ocean ridge system
- The Southwestern Indian Ridge, 9°–15°E area. This region has one of the slowest effective spreading rate on the planet, meaning that there the thermal lithosphere is among the thickest under mid-ocean ridges. Much of the region has essentially zero crustal thickness, but melt is focus in a few discrete volcanic centers. We were able to explain this distribution of volcanism with our three-step model. one seamount is located where the permeability barrier is shallowest and collects all the melt generated in that area. The second is located at a change in ridge azimuth, where melts following the permeability barrier first encounter the MEZ.
- The East Pacific Rise is among the fastest ridges on the Earth. Although a region transform faults likely generate a region of relatively cold mantle, geophysical and geological observations indicate thick crust along the Siqueiros Transform Fault. This can be explained by the presence of a MEZ along the transform, which allow extraction of melt that crosses the transform domain at depth. This adds new crust in the transform domain to the regular thickness crust formed at the spreading center.
- A global compilation of gravity derived crustal thickness at transform faults reveals thicknened crust at fast and intermediate ridges but not at slow ridges. Graduate Student Hailong Bai modeled each of the transforms discussed by Gregg et al., (2007) and finds he is able to reproduce the change in behavior if the MEZ is 2 to 4 km wide and reaches depth of 15 to 20 km. He also need to homogeneize crustal accretion in each segment over a length scale of 50 to 70 km, which likely represents melt redistribution at crustal levels with dike (a new step in our model?). This work is currently under review for Earth and Planetary Science Letters.
- Graduate Student Mark Larson is working on applying this model to the 35° – 40° of the Southwest Indian Ridge. This region is likely influenced by the nearby Marion hotspot. In addition to including the temperature anomaly associated with the hotspot, Mark is working on tracking the composition of melt to identify where along the ridge axis the chemical signature of the hotspot may be expected. His work is conducted in part as a participant to the East Asia and Pacific Summer Institutes for U.S. Graduate Students (EAPSI) thanks to which is spending a summer at the University of Tokyo.
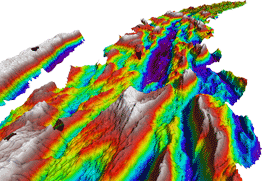
Bathymetry of the Southwest Indian Ridge with Joseph Mayes Seamount in the foreground (white top) looking toward the deep, 200-km long OS2 ridge segment (purple and black) where essentially no crust is accreted.
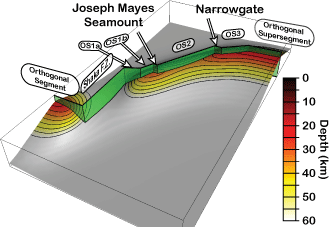
Geometry of the permeability predicted under the Southwest Indian Ridge 9°-15°E region, color-coded with depth. The green ribbon indicates the plate boundary, with segment names labelled.
 Preliminary model of the permability barrier geometry at 35°-40°E along the Southwest Indian Ridge. Note the rapid variations of crustal accretion rate (red ribbon) along the ridge due to the detailed segmentation implemented in this model. Image by Mark Larson.
![]()
Geometry of the permeability barrier and the Melt Extraction Zone at a fast spreading center (left) and a slow spreading center (right). The gap between the permeability barrier and the MEZ at the slow spreading center underneath the transform prevents melt extraction in the transform domain, leading to thin crust there. The opposite is true in the fast spreading center case. Image produced by Hailong Bai
 This research is sponsored by the National Science Foundation, Division of Ocean Sciences, Marine Geology and Geophysics program through grants 06-49103 and 09-37277 and the East Asia and Pacific Summer Institutes for U.S. Graduate Students (EAPSI)
Tectonics plates dive into the earth's mantle at subduction zones. It is generally thought that the weight of these subducted plates, or slabs, is a mian driver for plate tectonics. A key parameter to understand this system is the degree to which slabs are coupled to the surrounding, warmer mantle. We generate models of mantle flow at specific subduction zones and predict the spatial distribution of rock fabrics which can be detected by seismic means.
Participants
- Karen Paczkowski
- Kevin Miller
- Maureen Long
- Laurent Montesi
Seismic anistropy at subduction zones
When rocks deform under pressure and temperature conditions representative of the lithosphere, the individual minerals tend to rotate until their crystallographic axes are oriented in a systematic direction, producing a rock fabric. The way that seismic waves propagate in minerals depends on the orientation of these axes. Therefore, a consistent mineral fabric increases the speed that certain seismic waves travel through the mantle.
Collaborator Maureen Long is studying seismic waves at many subduction zones to constrain fabric the rock fabric present at various locations. A two-dimensional model of mantle flow entrained by subducting slab would predict that the fast axis of anisotropy should be perpendicular to the trench that separates the two plates are a subduction zone. However, Maureen Long showed that in many places, anisotropy is roughly parallel to the trench, essentially the opposite of this prediction. This is particularly puzzling for anistropy constrained to be below the slab. We have produced new geodynamic models that can explain these observations.
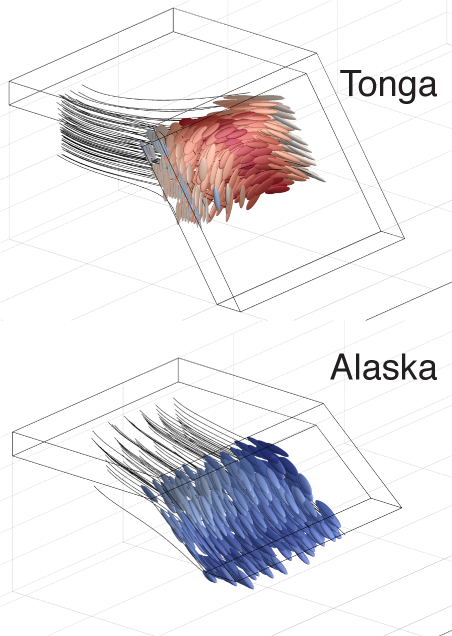
Strain ellipses predicted under a slab with the geometry and ambient mantle flow of the Tonga (top) and Alaska (bottom) subduction zones. The color corresponds to the orientation ofthe ellipses and range from trench-parallel (red) to trench-perpendicular (blue) depending on whether the ambient mantle is deflected towards the sides of the slab (Tonga) or below the salb (Alaska).
Mantle flow at subduction zones
Research Associate Karen Paczkowski have developed three-dimensional models of mantle flow at subduction zones. These models ignore complexity arising from mantle rheology or the detailed shape of slabs. However, they consider that there is relative motion between the slab and the surrounding mantle. This motion is the combination of large-scale convective patterns in the mantle and migration of the trench with respect to the subducting plate.
In our model, the slab acts as an obstruction to mantle flow. Mantle flow entrained by the slab is restricted to a thin sheeth around the slab. The dominante component inthe region sampled by seismic studies is the background mantle flow trying to pass around the rigid slab. Repending on the intensity of hte background flow and on the depth reached by the slab, flow may pass to the side or underneath the slab, resulting in trench-parallel or trench-perpendicular mantle flow, respectively. Collaborator Chris Thissen showed that the strain accumulated by the mantle in these cases is also trench-parallel or trench-perpendicular. These models are able to explain the seismic observations of most well-studied subduction zones.
Origin of seismic anistropy
Graduate student Kevin Miller developed a description of fabric based on averaging ellipses that represent the orientation of individual minerals. He also developed simple differential equations that describe how these ellipses evolve as a rock aggregate deforms when various deformation mechanism are active. His formulation also incorporates a component of randomization that leads to healing of the fabric. This model was calibrated in order to reproduce laboratory experiments of fabric development. We are currently devising new tests of this model and prepare the code for publications. As it is based on fairly simple differential equations, this method can be efficiently applied to three dimensional mantle flow models to predict the fabric present in the mantle in various geodynamic environments.
This research is sponsored by the National Science Foundation, Division of Earth Sciences, Geophysics program through grant 09-11151
One of the Grand Challenges of Earth Sciences concerns the origin of plate tectonics. This global tectonic regime can only be achieved if the lithosphere (crust and cold uppermost mantle) can achieve a duality of strength: strong over vast areas (plate interiors) and weak in narrow bands (plate boundaries). We explore the origin of this weakness by developing rheological modes of the lithosphere and how deformation weakens deforming rocks. Weakening with strain indeces a positive feedback loop that may give rise to localized deformation, in the shape either of shear zones or plate boundaries.
Participants
- Frédéric Gueydan
- Laurent Montesi
Phenomenology of Localization
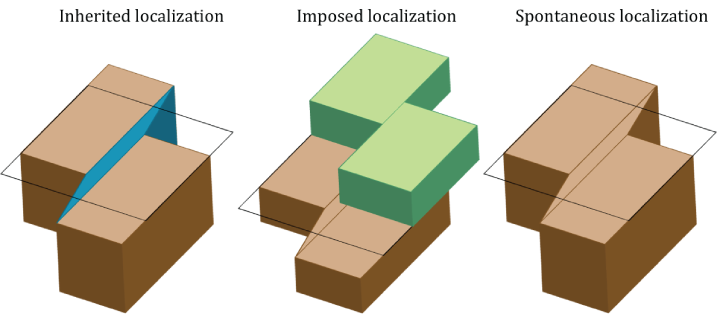 Schematic depiction of inherited, imposed, and spontaneous localization. The brown blocs represent the reference material, blue a preexisting heterogeneity, and green an external material which is itself localized or heterogeneous.
We identified at least three scenarios that result in a localized deformation zone
- Inherited localization. A deforming region contains a preexisting heterogeneity, where either a different rock type is present, or there different deformation conditions, such as the presence of fluids of high water fugacity. Deformation is enhanced in the resulting weak zone.
- Imposed deformation. A uniform region is loaced by heterogeneous boundary conditions. Stress may be increased due to the action of a nearby localized deformation zone or fault, for example, or an adjacent heterogenous region, containing weak or strong zones.
- Spontaneous localization. A uniform region under uniform loading may still develop localized shear zones if its material behavior is intrinsically unstable. Typically rocks become weaker due to the change in a state variable that may correspond to damage in the britlle regime or another microscopic or mesoscopic structural parameter. It may be possible for the state variable to evolve fast enough with deformation to overcome any strain or strain rate hardening instrinsic to the rock rheology, leading to localized defomation.
In Montési and Zuber (2002), we developed a measure of the the combined effect of rheology and state variable evolution, the effective stress exponent. Spontaneous localization arises when the effective exponent is negative. This was also applied to identify the possibility that localized shear zones develop on Mercury (Zuber et al., 2010)
Localization potential
To better compare mechanisms that can give rise to localization, we developed a localization potential (Montési, 2013). It compared the strain achieved for a given stress by a reference homogeneous region to that in a perturbed region containing a heterogeneity in which all the deformation takes place. For a given overall velocity, the strain rate in the heterogeneity is high. However, the total energy dissipation can still be less in the localized stress is the heterogeneity contains a weaker rock. The localization potential indicates how much narrower than the reference state the heterogeneity can be while still being the locus of thedeformation.
Montési (2013) present analytical expressions for the localization potential in the cases where the heterogeneity corresponds to high temperature, a reduced grain size, breakdown of feldspar to form mica, or a fabric in which micas are interconnected, and a few other cases. Although precise estimates of localization potential require specific choices that describe both the reference state and how the heterogeneity is implemented, we find that interconnection of mica has a much higher localization potential than other mechanisms, unless the ambient stress is close to mica strengh (1 to 10 MPa).
Strength of the continental lithosphere.
In Montési (2007), we developed a rheological description appropriate for a material that is imperfectly layered and a differential equation describing the evolution of the degree of layering with strain. This formulation, tested against the laboratory experiments of Hoyoke and Tullis (2006) allow predictions of the strength evolution of a deforming multiphase aggregate.
Collaborator Frédéric Gueydan implemented this formulation into a numerical model of deforming rock masses to simulate how weakening an localization proceed in the the middle-crust, where an common rock assemblage may be composed or feldspar and biotite. He showed that as deformation progresses and layering increases, the rock becomes weaker, at least at temperature less than 450°C (mica is not remakably weak at higher temperature). In the brittle upper crust, weakening is associate with damage and fabric development inside faults. In the uppermost mantle, weakening can arise in association with grain size reduction if deformation temperature is low enough (600°C or less) that dislocation-accomodated grainboundary sliding is active. In summary, strain weakening is predicted everywhere except in the lower crust.
In Gueydan et al. (2014), we explore the consequences of these process for the strength of the lithosphere. We concluded that the strength profile of the crust changed markedly with strain. At low strain (plate interiors), the mid-crust and uppermost mantle are the strongest region of the continental lithosphere. As strain proceeds, strenght is lost progressively. Deformation rate increases until the lower crust (where no efficient weakening process was identified) becomes the strongest region of the lithosphere. This strength profile is appropriate for actively deforming region, like Southern California around the San Andreas Fault.
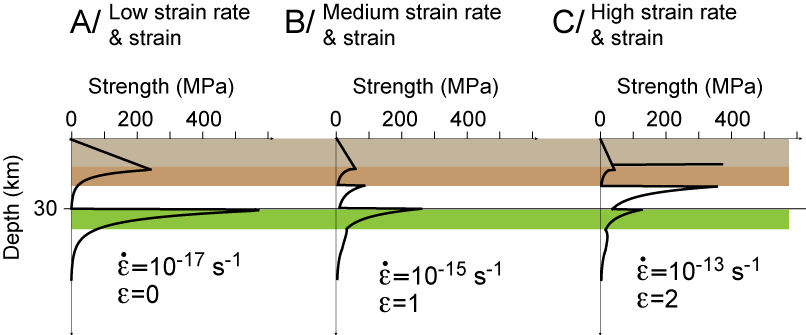 Change in the strength profile of the lithosphere as strain and strain rate increase (From Gueydan et al., 2014)
Localization and Planetary Tectonics (project under development)
It is particularly interesting to note that only the Earth display plate tectonics at global scale. This stands in contrast with the tectonics of Venus even though Venus and the Earth have similar size and therefore, one may think, the same convective vigor. That convective vigor is also relevent for Mars in the early Hesperian epoch (rough 3 billion years ago). We follow the hypothesis that these planets did not develop plate tectonics because of a different overall behavior of the lithosphere.
Our study of localization processes in the terrestrial lithosphere has demonstrated the importance of various microstructural changes in allowing deformation to localize unto narrow shear zones. We are evaluating the efficiency of these processes for other planetary lithosphere to evaluate the likelihood of forming localized shear zones are depth.
To further constrain localization processes we will develop numerical models of deforming planetary lithosphere to predict patterns of faults and shear zones for comparison with geological observations.
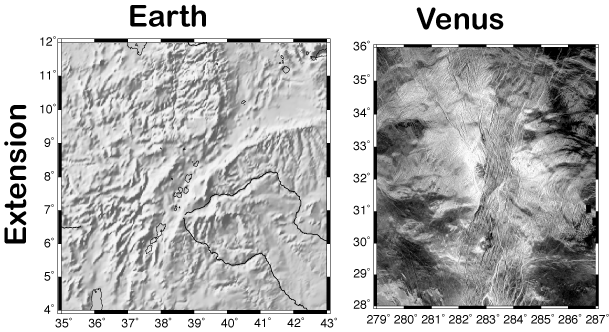 Rifts on Earth (East African Rift, left) and Venus (Devana Chasma, right) can develop strikingly similar morphology, which is different from oceanic rifts on Earth. This may indicate similar localization processes in the lithosphere and similar loading mechanisms. Manifestations of shortening are very different on Earth and Venus. Modified from Montési, (2013).
Tectonic Loading
In the absence of plate tectonics, the lithosphere is stresses by the direct action of mantle convection, applied to the base of the lithosphere, not by far-field stresses transmitted through the lithosphere. We are using numerical models to characterize how this difference in loading mechanism affects the pattern of tectonic deformation and whether it is possible to generate localized rifts similar to what we observe on Venus.
Fault Spacing in Planetary lithosphere
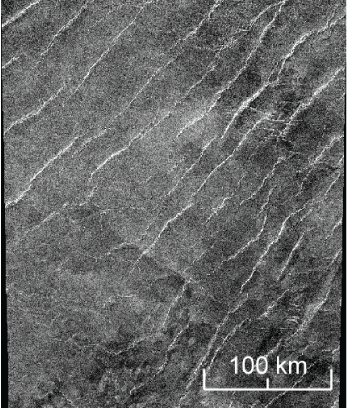 Magellan image of Zhybek Planitia on Venus, showing regularly spaced wrinkle ridges, generally thought to represent the surface expression of a buried thrust fault.
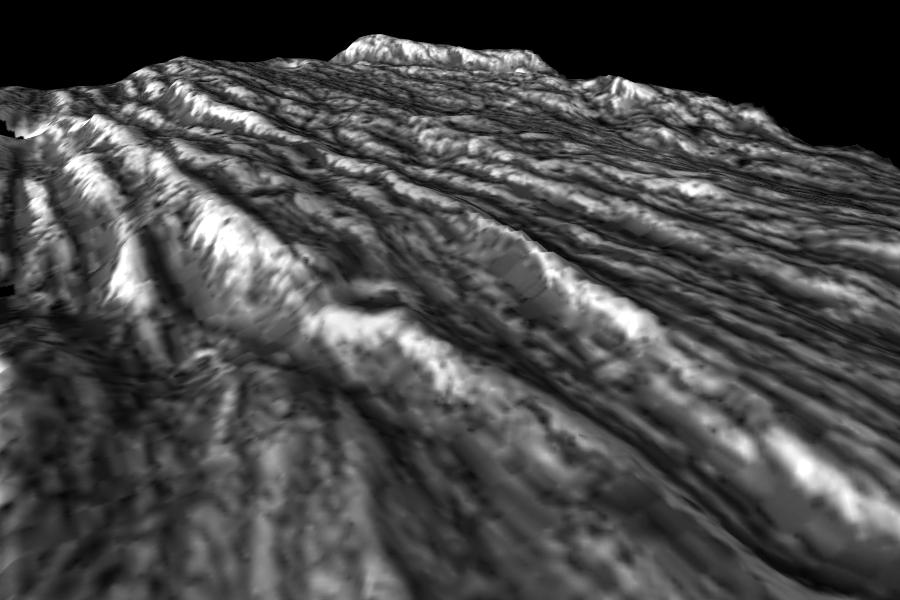 Three-dimensional rendition of the "grooved terrain " on Ganymede, which displays two tectonic wavelengths: one associate with necking ot the lithosphere, seen in the topography, the other associated with regularly spaced fault, seen in the successive dark and light bands in this image. Planetary Photojournal image PIA01620.
Many planets display a network of faults with a regular spacing. In Montési and Zuber (2003a), we adapted a semi-analytical model of lithospheric buckling to consider the family of rheologies that may give rise to localized deformation, those wiht a negative effective stress exponent. We find that fault spacing is proportional to the thickness of the layer in which localization takes place, but has additional dependences on variation of strength with depth and the exact value of the effective stress exponent. Nevertheless, it is possible to explain with this theory the spacing of faults observed in the Central Indian Ocean (Montési and Zuber, 2003b),ridged plains on Mars (Montési and Zuber, 2003c) and Venus (Montési and Zuber, 2002), and normal faults on Ganymede (Montési and Collins, 2005). When applying this analysis to Mars, Montési and Zuber (2003c) were able to match simultaneous the spacing faults in the Northern Lowlands and Southern Highlands of that planet by considering the difference in crustal thickness between these regions. This gave a new constrain on the heat flux in during the geological epoch when these faults formed.
 Schematic diagram of a wrinkle ridge and the underlying structure. After Montési and Zuber (2003c)
![]() Parts of this research is sponsored by the National Aeronautics and Space Administration (NASA) Science Directorate, Planetary Geology and Geophysics program, through grant NNX10AG41G
Parts of this research is sponsored by the National Aeronautics and Space Administration (NASA) Science Directorate, Planetary Geology and Geophysics program, through grant NNX10AG41G
Europa is the second Galilean moon ofJupiter. It is famous for having an global ocean of liquid water beneath the surface, which may be able to sustain life (speculative). We are exploring the possibility of having water bodies inside the ice crust above the Europan ocean by modeling what their surface expression would be an comparing it to geological observations.
Participants
- Stephanie Johnston
- Laurent Montesi
Ridges
Most of the surface of Europa is covered by ridges, many of which are actually composed of two parallel ridges around a central crack. In Johnston and Montési (2014), we explored the possibility that ridges form above a long body of water inside the crust, likely formed along a preexisting crack. As the water freezes, it expands, putting the surrounding ice under compression and causing it to buckle. Depending on the geometry of the water body, the compression may simply uplift the surface above the water body, forming a single ridge, or buckle the ice on both sides ofhte body, forming a a double ridge. Although this process is able to produce morphologies similar to the geological observations, expansion needs to be much larger than due to freezing of ice alone, which may indicate either that bodies of water form repeatedly in the same location, or that gases are exsolved during crystallization, greatly increasing the volume of the water body.
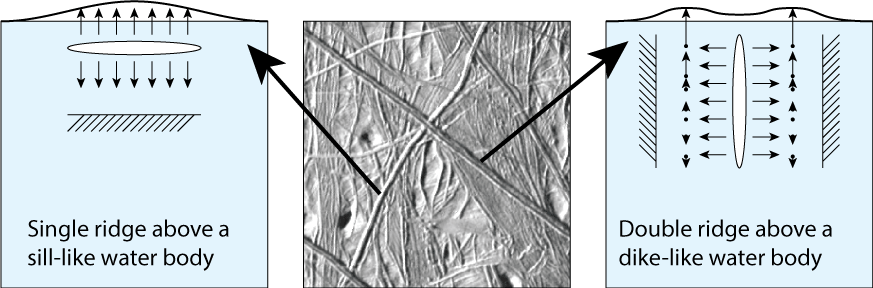
Schematic diagram describing how single or double ridges may form by expansion of freezing water around sill-like (left) or dike-like (right) water bodies inside the ice crust of Europa. The central image shows a region where both single and double ridges may be identified. From Johnston and Montési (2014)
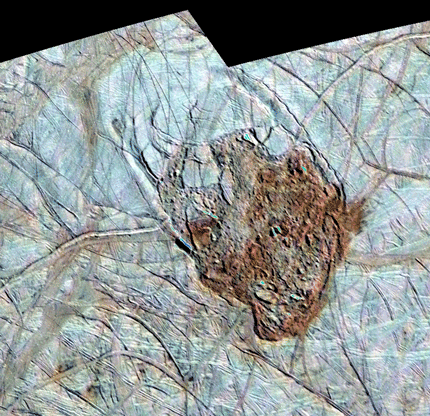
Galileo SSI image of Thera Macula. Note the circular crack outlining the feature and the coloration indicative of salt-rich material exposed on the surface. Portion of Image PIA02099 from the NASA Photojournal.
Maculae
Circular regions where the surface of the ice is disrupted are called maculae. We followed the hypothesis proposed by Schmidt et al. (2011) that maculae develop atop a circular water body, or sill. Our model includes a region that expands as ice warms up in response to a hot plume rising in the ice shell, and a sill where ice melt. The plume produces uplift in that region and the melting forms an ice cauldron. Even after the water crystallizes again and the plume cools down, a residual topography is present due to plastic deformation during the ice cauldron stage. We predict a ring of premanently uplifted ice with a circular graben above the edge of the sill, in agreement with geological relations. However, we predict very little cracking in the model. It is unlikely that cracks above the sill will act as conduit of salt-rich water from the sill to surface and initiate wholesale disruption of the macula interior.
![]() This research is sponsored by the National Aeronautics and Space Administration (NASA) Science Directorate, Planetary Geology and Geophysics program, through grant NNX10AG41G
This research is sponsored by the National Aeronautics and Space Administration (NASA) Science Directorate, Planetary Geology and Geophysics program, through grant NNX10AG41G
Participants
- Joe Schools
- David Krasner
- Laurent Montesi
Melt Migration
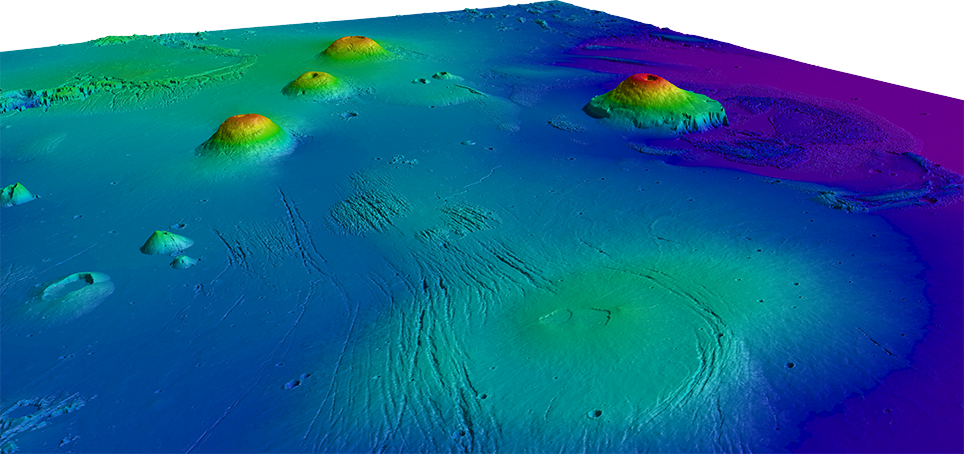 three-dimensional rendition of the Tharsis Volcanic province showing the numerous large volcanoes there and how they appear to have a regular spacing. Alba Mons is in the foreground, Olympus Mons to the right, and the three Tharsis Montes for the line of high volcanoes to the left.
In a project about to start, we will adapt our three-step melt migration model, developed for mid-ocean ridges on Earth, to the martian lithosphere. The first task will be to determine where in the lithosphere permeability barriers may develop. In the absence of plate tectonic processes, we do not anticipate the barrier to have much relief that would focus melt toward specific locations. However, thermo-chemical feedback processes may render the barrier unstable. We will study this instability in detail and charaterize any length scale that may spontaneously arise. These length scales will be compared with the observations of characteristic spacing made by collaborators Jacob Bleacher and Christopher Hamilton, as well as the spacing of major volcanic centers in the Tharsis province.
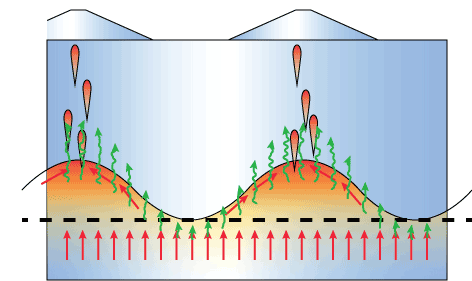 Schematic representation instability development in an inially horizontal permeability barrier (red) leading to the development of regularly-spaced volcanic centers.
Growth of volcanic edifices
Undergraduate student David Krasner is conducting his senior thesis in the Geodynamics modeling volcano development. He uses the flexural response of the martian lithosphere under the load of a volcanic edifice to determine where subsequent eruptions should take place and build the volcano progressively. We how to relate the shape of the resulting volcano with the elastic thickness. This project follows concepts developed by McGovern et al. (2013).
![]() This research is sponsored by the National Aeronautics and Space Administration (NASA) Science Directorate, Planetary Geology and Geophysics program, through grant NNX14AG51G
This research is sponsored by the National Aeronautics and Space Administration (NASA) Science Directorate, Planetary Geology and Geophysics program, through grant NNX14AG51G
Melt is present in equilibrium with solid grains inside mantle rocks at mid-ocean ridges and subduction zones. In a project lead by Wenlu Zhu, we are imaging the distribution of melt at microscopic level in laboratory-generated samples and simulate transport properties of the aggregate to provide new constraints on the large-scale behavior of melt and the constitutive equations that enter our other models.
Participants
- Kevin Miller
- Wenlu Zhu
- Glenn Gaetani
- Laurent Montesi
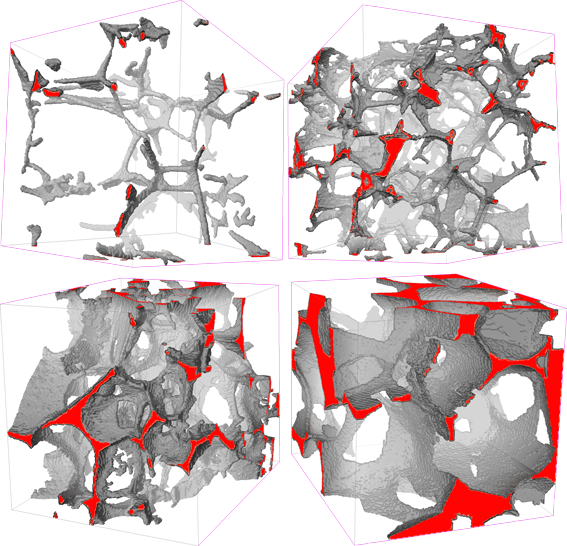 Three-dimensional reconstruction of the space taken by melt in olivine-basalt aggregates with 2, 5, 10, and 20% melt content. From Zhu et al. (2011)
Imaging three-dimensional melt distribution
Graduate student Kevin Miller synthetized melt/olivine/pyroxene aggregates in Glenn Gaetani's lab at WHOI. With Wenlu Zhu, he took these samples to the X-Ray Synchrotron facility at Argonne National Laboratory and used the data collected there to reconstruct in three dimensions the distribution of melt inside the sample.
The first reconstructions were published in Zhu et al. (2011), constituting the first time we were able to image basaltic melt in an olivine aggregate in three dimensions at with micron-scale resolution. These first images showed that melt resides in tubules along the junction between three grains that form a globally connected network even at low melt fraction of 2%. This makes it possible for melt to travel rapidly through the mantle even for the low melt fraction detected beneath mid-ocean ridges.
Kevin Miller improved on this study by 1) improving our image processing sequence to between identify solid and liquid phases and 2) considering three phase aggregates (basaltic melt, solid olivine, and solid pyroxene) that better respresent mantle mineralogy. With this new dataset, he is able to quantify to what extent melt is concentrated in pyroxene-rich regions, which has been proposed as a way to facilitate melt transport. However, as pyroxene is uniformly distributed in our samples, permeability enhancement due to this lithological partitioning is negligible.
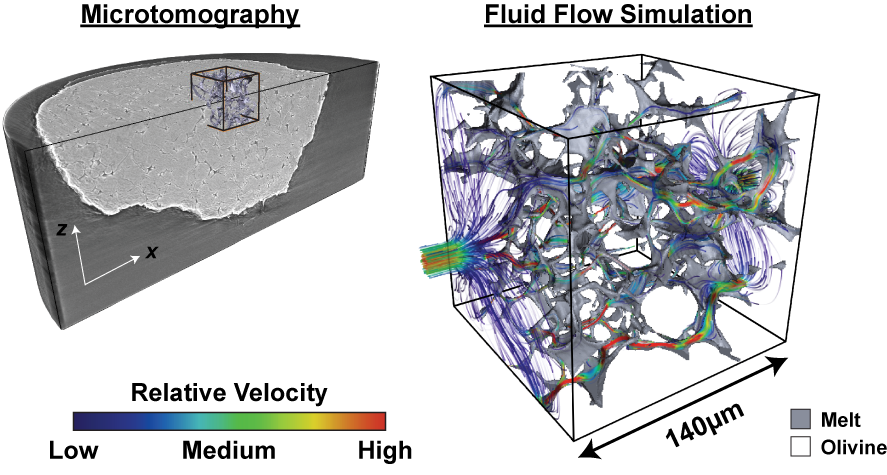 Right: Simulation of fluid flowing through the space occupied by melt in an experimental aggregate; the colors correspond to fluid velocity. Left: location of the simulation domain inside the larger experimental sample. From Miller et al. (2014).
Transport properties
Graduate student Kevin Miller simulated flow through the space occupied by melt inside the samples using a finite volume method provided by our imaging software, Avizo. In Miller et al. (2014), we published the best constraint to date to permeability of partially molten samples: k=(ϕn d2)/C, , where n=2.6±0.2 C=58−22+36.
Kevin is currently working on alternative methods to simulate fluid flow and extending his work to simulating electrical currents, which will allow us to constrain electrical conductivity in addition to permeability.
This research is sponsored by the National Science Foundation, Division of Earth Sciences, Geophysics program through grant 12-50338 to P.I. Wenlu Zhu.
Participants
- Lisa Walsh
- Jeanne Sauber
- Aaron Martin
- Laurent Montesi
The 2011 Mineral, VA earthquake
![]() Stress change in faults near the 2011 Mineral earthquake. The regions in red correspond to an increase in earthquake possibility, Note that the increase is small and that these faults are probably all quite far from being ready to fail and generate an earthquake.
Stress change in faults near the 2011 Mineral earthquake. The regions in red correspond to an increase in earthquake possibility, Note that the increase is small and that these faults are probably all quite far from being ready to fail and generate an earthquake.
On August 23, 2011, the Washington, D.C., region was shaken by a Magnitude 5.8 earthquake that took place in Central Virginia. Then-Ph.D student Lisa Walsh, now since graduated and took a job as a seismologist at the Nuclear Regulatory Commission, took the initiative to study this event and its implications for seismic hazard in the mid-atlantic states. This work is current inpress for a Geological Society of America special publication on the Mineral earthquake.
The earthquake took place at the edge of the Central Virginia Seismic zone, a region where small to moderate earthquake regularly take place. Lisa Walsh calculated the change of stress in the crust that resulted from the earthquake. The stress change is generally too small to affect other faults in the region that have been active during the last few millions of years and in most cases, the effect would be to decrease the likelihood of future earthquakes. However, stress and earthquake risk have been increased along some part of the Spotsylvania fault and Chpawamsic faults, a few kilometers from the earthquake epicenter. Fortunately, these faults have not been recently active. Therefore, we cannot know how close to failure they actually are.
Lisa Walsh also calculated the surface uplift associated with the earthquake, but found it to be too small to be detected by instruments in place during the event.
Lisa Walsh also showed that the rate at which aftershock activity decreased after the earthquake was much slower than after equivalent earthquakes in California. This may reflect the different stress conditions in the more stable eastern United State compared to the active plate boundary in California. Aftershock activity also increased after 25 day as a new fault seems to become more active, which is a very rare occurance in other tectonic environements.
Postseismic deformation
The ground does not stop moving after an earthquake. Space geodesy techniques, including high-resolution GPS and InSAR have detected weeks– to month–long periods following large earthquakes when the ground continued deforming, albeit in a slow and continuous manner, call postseismic creep, which does not in and of itself produces earthquakes. However, this deformation changes the stress field in the surrounding crust, and, under certain circumstances, may increase the likelihood of future earthquakes.
We followed the hypothesis that postseismic creep takes place in a ductile shear zone that geological information indicated may be present beneath the seismogenic fault. In Montési (2004a), we proposed that, if postseismic creep takes place in a shear zone, it should accumulate with time according to the general algebraic formula with three parameters: an initial postseismic velocity, a time scale, and and exponent n that indicates the degree of nonlinearity of the shear zone rheology. This formula can cover linear viscous materials (n=1), powerlaw behavior (n=3 to 5), a even brittle behavior (1/n=0). However, we find that in most case, postseismic creep is best modeled with negative values of n, which implies that the zone where postseismic deformation takes place is fairly diffuse and/or external loads are important.
In Montési (2004b), we discuss how the initial postseismic velocity is controlled by the strenght of the shear zone. We concluded that shear zones are much weaker than what would be expected from laboratory-derived flow laws. We are currently revising this idea by taking into account the improved understanding of what causes weakness in ductile shear zones, especially the importance of fabric and interconnected micas.
This research is sponsored by the National Science Foundation, Division of Earth Sciences, Geophysics program through grant 03–37678
Participants
- Will Junkin
- Garrett Mitchell
- Hans Schouten
- Debbie Smith
- Wenlu Zhu
- Laurent Montesi
Volcanic Activity
Undergraduate Student Will Junkin participated to a research expedition to the Mid-Atlantic Ridge 16.5°N. In that region, the seafloor gets deeper, implying less volcanic activity, towards the North. However, the pattern of faulting off-axis is consistent with the opposite trend, reduced volcanic activity towards the South.
Using a Geographical Information System (GIS) Will Junkin mapped small volcanic edifices in parts of the seafloor where high-resolution bathymetry collected by the Autonomous Underwater Vehicle Sentry was available. He estimate the total volume of recognizable volcanic products and the fraction of seafloor clearly covered by volcanoes. The northern region appears to have undergone mostly constant volcanic activity. However, the southern region has recently undergone a transition from volcanic-poor to the highest volcanic activity detected in the region. We concluded that the axis depth indeed corresponds to high volcanic activity, but that this is a different geodynamical regime than that reflected by off-axis fault morphology. This indicates that volcanic activity can change dramatically over time scales of less than 1 million years.
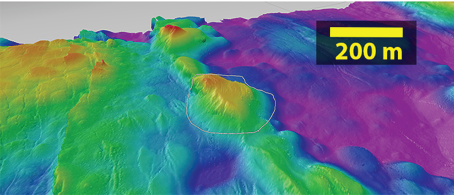 Example of seafloor bathymetry imaged in three-dimensions with the Fledermaus software highlighting a single volcanic construct, cut by a fault on the left edge. Image by Will Junkin.
Mechanics of triple junctions
Plate boundaries form an interconnected global network. Occasionally, mid-ocean ridges meet at a triple junctions. We have been part of an effort, lead by Debbie Smith and Hans Schouten at WHOI, to study in detail the tectonics and evolution of the Galàpagos triple junction, in the Eastern Pacific ocean.
The Galàpagos Triple junction is where the Northern East Pacific Rise, the Southern East Pacific Rise, and the Cocos-Nazca Rift all meet at one point. Actually, the Cocos-Nazca rift is not directly connected to the other two. It propagates westward toward the East Pacific Rise, breaking the lithosphere formed to the East of the East Pacific Rise into two plates, but never seems able to "catch up". This is surprising because it has long been shown that if a triple junction between three ridges is formed, it is very stable, meaning that there is no reason for the ridges to loose their connection. However, there is a mechanical reason why the Cocos-Nazca Rift does not join the other two.
Master Student Garrett Mitchell, who now works at at Fugro GeoConsulting Ltd, developed models of the triple junction in which each rift is regarded as a stress-free crack loaded by far field plate motion. Stress concentration at the crack tip of the Cocos-Nazca Rift slightly bend the East Pacific Rise, producing a zone of compression ahead of the rift and preventing the Cocos-Nazca Rift from getting too close to the East Pacific Rise. However, we predict that new cracks should shoot eastward from the East Pacific Rise somewhat North and South of the projected triple junction (Mitchell et al., 2011). At 2°20'N we see indeed that there is a small rift and that short-lived rifts have developed in that location for a long time, confirming the validity of our model (Schouten et al., 2008). We learn along the way that the rifts must have very little strength, which likely reflects the lubricating effect of magma inside the crust and the thin lithosphere at the ridge axis.
To the south of the projected triple junction, however, we find a much more complex geological set up, featuring a large gash in the seafloor, Dietz Deep, a large seamount, Dietz Seamount, and a prominent volcanic ridge that is directly connected with the East Pacific Rise at 1°10'N (Smith et al., 2011). Geological reconstruction of the region indicate that the 1°10'N triple junction had a behavior similar to the 2°40'N triple junction, with short lived rifts, until about 1.2 million years ago, when a small hotspot enters the system. This hotspot has since generated Dietz Seamount and it seems that the increased magmatic flux has stabilized the system, making it possible to construct the major volcanic ridge seen in the region (Smith et al., 2013).
Participants
- Tom Watters
- Laurent Montesi
Mercury's 'Great Valley'
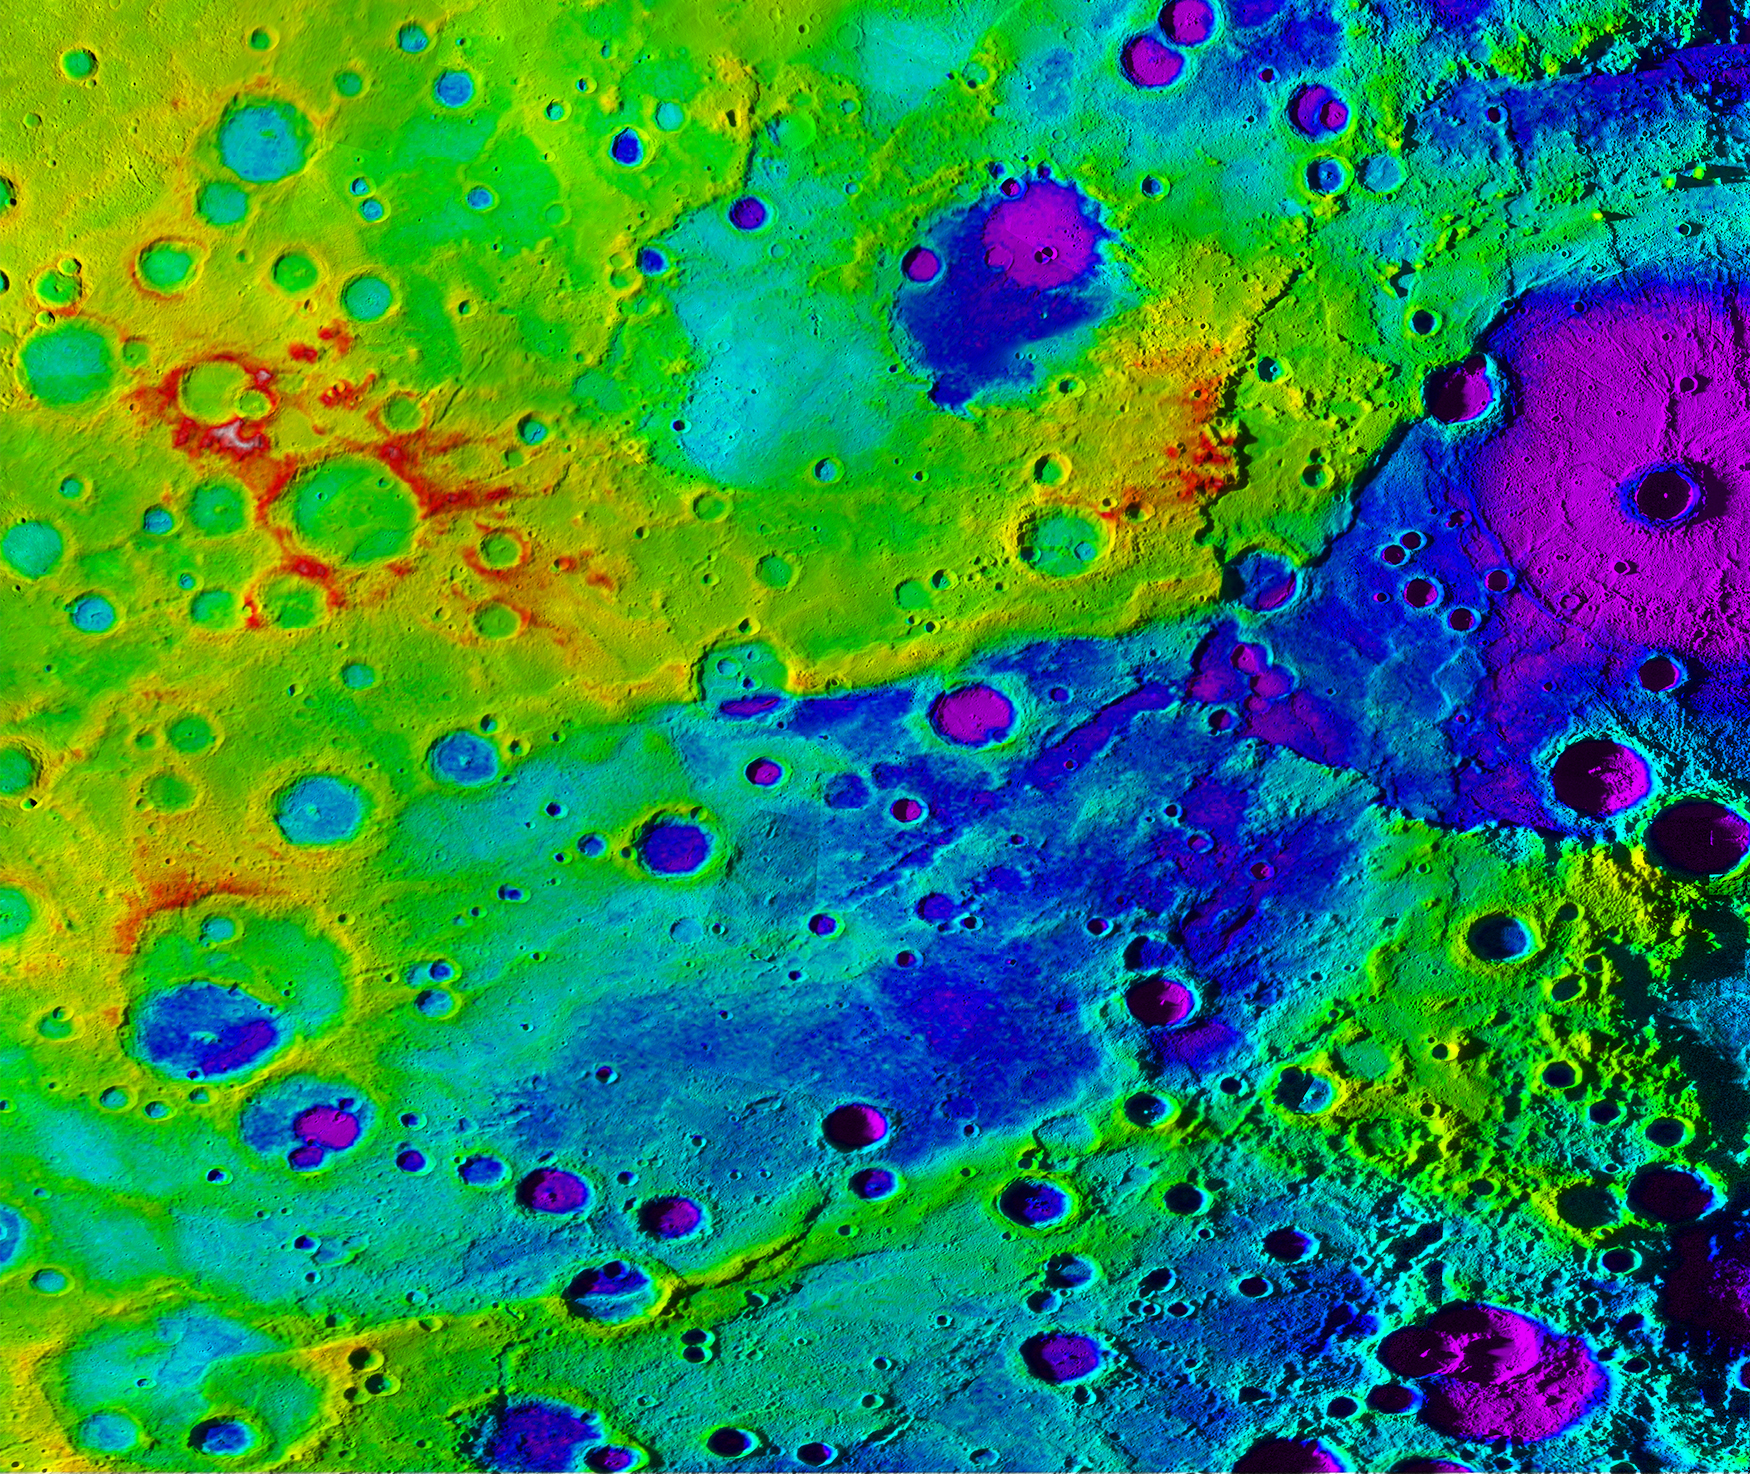
Using colorized topography, Mercury’s “great valley” (dark blue) and Rembrandt impact basin (purple, upper right) are revealed in this high-resolution digital elevation model merged with an image mosaic obtained by NASA’s MESSENGER spacecraft. Credits: NASA/JHUAPL/Carnegie Institution of Washington/DLR/Smithsonian Institution
Tom Watters, from the National Air and Space Museum, participated in the the MESSENGER mission, which returned amazing data about Mercury. In particular, he identified from topography and images a 'Great Valley' that cuts the lithosphere over a length of 1000km and deforms the rim of Rembrandt Basin. Tom's structural analysis shows that the valley is bounded by faults that form a coherent structure. Our mechanical analyses imply that the lithosphere of Mercury was able to buckle with a wavelength of several hundred km, which implies that is was several tens to hundreds of km thick. That is very surprising when considering that the mantle of the planet is likely only 400 to 600 km thick. Is it possible that the entire mantle is cold enough to be considered lithosphere? Recent volcanic activity seem to contradict this notion, unless, of course, Mercury is more active today than in the past...
This work was reported in Watters et al. (2016)
Animation of 3D perspective view of Mercury’s great valley. The animation begins with Mercury’s great valley, as seen in a high incidence angle image mosaic obtained by NASA’s MESSENGER spacecraft, extending from the Rembrandt basin (upper right) for over 1,000 km (lower left). The image mosaic transforms into a colorized digital elevation model created from stereo images of the region. The vertical exaggeration, the difference between the vertical and horizontal scale, is increased until it reaches about 8× to emphasis the topographic relief.